You are using an out of date browser. It may not display this or other websites correctly.
You should upgrade or use an alternative browser.
You should upgrade or use an alternative browser.
You don't need much patches to create a good printer profile
- Thread starter pharmacist
- Start date
- Thread starter
- #32
- Joined
- May 29, 2007
- Messages
- 3,020
- Reaction score
- 1,752
- Points
- 333
- Location
- Ghent, Belgium
- Printer Model
- SC-900 ET-8550 WF-7840 TS705
Ohh, I think we are talking about something different. I know that the Colormunki software works with the 2-steps method and corrects back for the curvature in the RGB colour space based on the difference between the expected value and the measured value. I mean the possibility of measuring reference targets and see how the quality of the generated profile is compared to a target that is printed with that specific profile in o.rder to estimate the Delta-E value, like you can do in i1Profiler (for example: measure chart) and ArgyllCMS.????????
Nelson, the Colormunki does just that, measuring a first fresh corrected print (2nd target) and avaluates wether the changes worked and then creates the final profile
- Joined
- Dec 27, 2014
- Messages
- 6,352
- Reaction score
- 7,569
- Points
- 373
- Location
- Germany
- Printer Model
- L805, WF2010, ET8550, T3100X
Not directly, there is no profile editor to do that.OK I can measure a target printed with the profile but can I then finetune the profile withe the measured Delta-E?
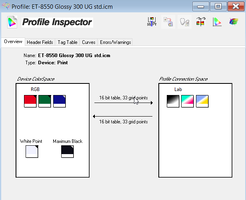
A profile typically consists of a data matrix of 33x33x33 or 17x17x17 data points, this data grid is independend of the number of color patches which get scanned as the first step. The size of a profile does not change if you enter the data for 196 or 400 or 2440 etc patches. The next step is a data recalculation and 3D interpolation and inversion from the input patch matrix into the profile output matrix , and the same happens with the data of the patch sheet to create the correction values . The profile contains several tables for forward and backward data lookup - A to B and B to A - device from/to the PCS - Profile Connection Space. But it is possible to add additional color patches - data points to your patchsheet , these data points are additional to the standard color grid e.g. 6x6x6 or 7x7x7 or whatever and in between the original data grid points.

Last edited:
Latest posts
-
-
How many color patches are needed for a (good) profile ?
- Latest: Ink stained Fingers
-
