
[Tool] ChromIQ – a macOS and Windows GUI for ArgyllCMS printer profiling (v3.13.0-beta)

pharmacist

Printer VIP
Platinum Printer Member
Joined
May 29, 2007
Messages
3,230
Reaction score
1,847
Points
333
Location
Ghent, Belgium
Printer Model
SC-900 ET-8550 +18100 WF-7840
Yes, but only for the profile generating process, not for scanning. That is done with it's own proprietary program and only patch by patch.
 

rjanowsky

Getting Fingers Dirty
Joined
Jul 1, 2026
Messages
44
Reaction score
15
Points
25
Location
Germany - Northern Ruhr Area
Printer Model
Epson SC-P600, HP Envy 4525
Thanks. I will go with this target and make some prints afterwards.
@pharmacist

I made a profile with the recommended target set and printed some B&W test images. Visually and measured the prints are nearly dead neutral. For me, it's perfect!
 

mavtop

Printing Ninja
Joined
Nov 14, 2021
Messages
147
Reaction score
41
Points
90
Printer Model
Epson XP 15000
Yes, but only for the profile generating process, not for scanning. That is done with it's own proprietary program and only patch by patch.
sad to read this,

today i tried with windows 11, no good news, but i built an USB-A cable to use with my 100W power adapter to give enough power to the old USB-2.0 hub, when i linked the usb hub and tried the i1pro1 device all seem to work, after 3 minutes of attempts (to see if it was stable) it begins to give calibration errors (out of tolerance white from the plate) again.

So i have two i1pro1 that both seem broken.
 

mavtop

Printing Ninja
Joined
Nov 14, 2021
Messages
147
Reaction score
41
Points
90
Printer Model
Epson XP 15000
the first i1pro1 has worked a total of 3 hours, the second i1pro1 has worked a total of 36m

so both would be like new, for this i don't understand, in the weekend i will try my usual i1pro1 on my old mac notebook where i used it in the past.
 

mavtop

Printing Ninja
Joined
Nov 14, 2021
Messages
147
Reaction score
41
Points
90
Printer Model
Epson XP 15000
good morning @itsab1989

i have two questions,

- i have a profile generated with chromiq and read using the Argyll chartread inside chromiq (so i have the ti3 file inside the structure of chromiq profiles):
Is it possible for the chromiq engine showing the aspected/detected value/colors in the measure chart page for the ti3 without knowing which software created it ?

- (feauture request) if i load a project (in the create chart page) and then go to measure chart if it found that was previously measured (if ti3 file is present) it shows the aspected/detected values showing a box that tell that a calibration exists and will be shown the values/colors ?

or it works only using the chartread chromiq version ?

i suppose that the ti3 file contains the detected values for each patch
 

mavtop

Printing Ninja
Joined
Nov 14, 2021
Messages
147
Reaction score
41
Points
90
Printer Model
Epson XP 15000
The instrument this morning seems wanting working, so i was reading the patch of the same paper Kyocera Laser printer (plain paper) i had read the last time using Argyll chartread, this one using chromiq chartread just to compare the results to try to understand if the device is reading properly.

After some rows reading it stopped to scan giving this error i will attach the screen and the logs of today tests

I tried to restart the calibration but i don't see the aspected/detected anymore

i'm continuing to scan the patch in this moment

1784883390999.png
 

Attachments

  • Screenshot 2026-07-24 at 10.48.51.png
    Screenshot 2026-07-24 at 10.48.51.png
    298.5 KB · Views: 5
  • chromiq.log.txt
    1.7 MB · Views: 1
Last edited:

mavtop

Printing Ninja
Joined
Nov 14, 2021
Messages
147
Reaction score
41
Points
90
Printer Model
Epson XP 15000
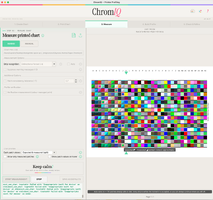
i finished the reading of patches, for @itsab1989 i didn't exit from the measure chart screen, never, but when the device gave the error i had to press stop and the software automatically switched to Argyll chartread removing all the old aspected/detected patch colors, i pressed stop again and then pressed continue and it started with chromiq chartread and the new reading appaired on the screen up to i finished the reading, but the old one seems lost.

I ask you is possible to ask a confirmation to use Argyll chartread, so if i choose no, the old values doesn't disappear from the screen ?

this is the screen of the last scanned patches

1784885925651.png


it seems that the printer has problems with green, dark blue, pink but maybe is normal i will try to build the profile and compare with the previolus one
 

mavtop

Printing Ninja
Joined
Nov 14, 2021
Messages
147
Reaction score
41
Points
90
Printer Model
Epson XP 15000
this scanning with chromiq has better results versus the first scanning (but maybe i was less accurate in the scanning process)

1784886450464.png
1784886508268.png
 

mavtop

Printing Ninja
Joined
Nov 14, 2021
Messages
147
Reaction score
41
Points
90
Printer Model
Epson XP 15000
I tried to reread 7 of the 19 strips, but visually no differences from previous reading and rebuilding the profile, it passed to delta e=0,74 from 0,75 and tells 18 strips instead of 19, so i suppose the reading is correct or the instrument is reporting about the same values.

so i supect the reading are right

anyway @itsab1989 it will be perfect if it shows all the previous reading when i do a refinement (while it shows the patches without any aspected/detected color) and it should indicate also which strips need refinements (with an X for example) so one knows which one to scan again (obviously these are requests if possible)
 
Last edited:

itsab1989

Printing Ninja
Joined
Feb 11, 2026
Messages
259
Reaction score
110
Points
80
Printer Model
Epson ET 8550, Canon Pro 300
@mavtop
I had the same thought reagarding showing this patch overlays when a ti3 file is available and you want to remeasure a chart. Once a ti3 is available this should even work for regular chartread. However I have tied those new viewing options to the new engine.
More for me for later as a space to save my thoughts: When a ti3 is already available for a chart you want to measure in the measure tab this is recognized by ChromIQ anyway and you get an additional option to re-measure the chart instead of starting from scratch (I don’t know the exact name for this option and I am on my phone at the moment but I guess it is the refinement measurement or something).
I think it should bo possible to add another option in a similar way that allows you to show the overlay based of the ti3 that is available.

That fallback to stock chartread was built in because of the feedback you gave a few days ago (you mentioned that you had more success with it than with the engine). So Claude decided to do this as a fallback for connection issues. But I think it should be possible to add a pop up window with friendly, extensive and easy to understand information for the user that would give him some option for how he would like to act on this (note: no text in the window or its buttons must be cut off using the apps real styling, needs to be confirmed visually by me because claude sometimes makes mistakes with such ui elements).

I can’t promise anything though because I will be on vacation starting this sunday and I won’t bring my laptop with me as my involvement with the app causes some discussion with my family. The same is true for Knut by the way. It looks like magic what AI is doing but you still have to look at every step it does, test things and at a point this got completely out of hand and became this big of project and we are starting to implement features we will never need ourselves (this does not refer to your request though by the way - as I mentioned I thought about this myself anyway).
And to be completely honest with you: the idea was to make an app that I would use myself. But so far I have never really used it myself for its purpose. The only reason I open is is to try out stuff that we added and find out bugs or anything that is bad about it to improve on it. Some days it is better but sometimes it is eating you up
 
Last edited:
Top