I believe I was able to figure out the two step process or at very least do someting useful.
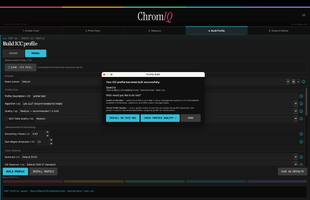
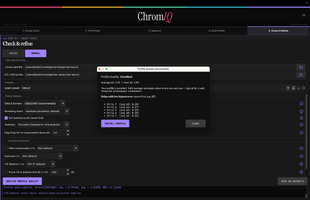
Here is a comparaison between my profiling tool (with new fancy 2 step process) and a multi-page profile I did with argyllcms
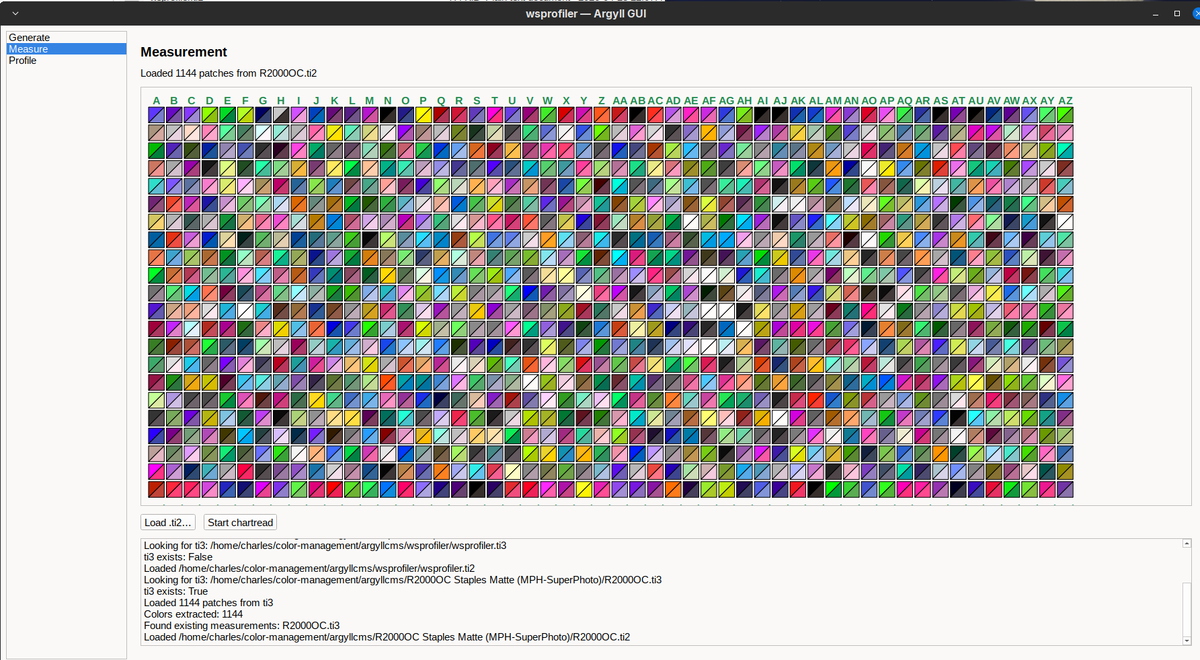
Now the first thing you are going to say is that it looks bad, but there is a caveat. The original profile was done with 1144 patches using proper procedures on an i1pro. The "combined measurements" profile was done with 30 patches on step 1 followed by 30 patches on step 2. All on 4x6 paper. This 2-step profile was done rapidly without even allowing the ink to dry for than 2 minutes. This was with a colormunki and it only took a minute to scan each set. With such a small set, I suspect that the colormunki might be better but even then, i'm not so sure. The reported gamut is smaller but it's dosent mean it's not accurate. It's probably OK for cheap snapshots on 4x6 paper. I havent printed with it
yet. There is a difference in the soft proof as one would expect (remember 60 vs 1144 patches)
I'm hoping that with a 1 page + 1 page approach on letter or A4 paper where we have a realistic number of patches, we might get a better result than a normal two-page profile
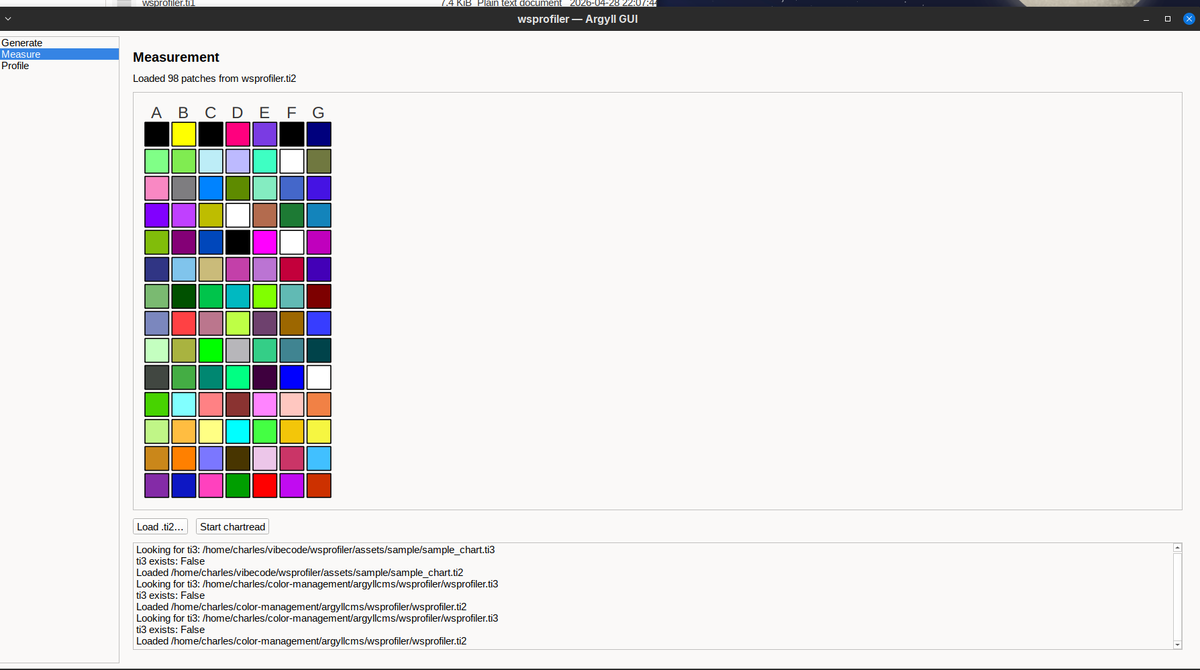
Here is the method... the first page uses targen and then generates a preliminary profile. It can be small and super easy to measure with something like a colormunki (I'm allowing single and double density modes)
For the second page, I'm using code that generates a custom ti1. The code builds a candidate pool of about 10000 rgb values using a few strategies: uniform 3d grid, mathematical space filling, neutral axis and hardcoded perceptual anchors (skin tones, foliage, sky, etc).
Each of the candidates is then converted to lab space through xicclu and then graded based on
- novelty: DE distance from the nearest existing patch in pass 1, but i soft cap at DE 30 to avoid having candidate patches that the printer will never be able to improve
- region undecoverage: the algorhytm will add weight to areas we havent sampled as well
- neutrality bonus: since the 2nd set is an optimisation set, we give some additional weight to near neutral colors
- luminance balance: patches in under-represented luminance areas (shadows/mids/highlights) are given some extra attention
Once we have our graded candidates, we add one white, one black and 3 gray patches. The remaining patches are then selected based on their ranking BUT they need to be at least 2.5 DE away from the patches in the original step 1 measurements.
The result is a second patch set that measures where the preliminary profile was weak and was missing information. At least that's the theory
At the end, I combine the ti3 measurements from step #1 and step #2 and hope that colprof now has enough information to build a decent profile.
I'm probably run a bigger next over the weekend with full colormunki double density pages