
- Thread starter
- #71

riclin
Getting Fingers Dirty
- Joined
- Oct 17, 2025
- Messages
- 69
- Reaction score
- 26
- Points
- 45
- Location
- Melbourne, Australia
- Printer Model
- Canon Pro-10S, Canon iP8760
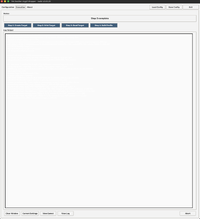
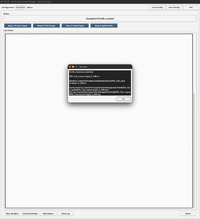
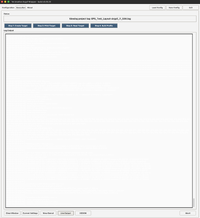
Are you sure Ron? Was there in fact log data to display? (although you did say that there was ....but it is necessary to do some work for log data to be generated.) I have tested under both Linux and inside the macOS VM and both instances are working fine here with the caveat that I am unable to view the X3DOM output inside the macOS VM - but that's a VM issue and nothing to do with YAAW. Under linux all functions work as expected.Measuring works again, but I got no log output. Not on screen and also the "View Log" button shows nothing - only a blank window. Logging into the log file was done. The X3DOM button works normally.
EDIT:
I've tested now YAAW under linux, inside a macOS VM and finally on a real mac - it worked flawlessly on all so I'm a little perplexed by your report. One possible cause however is white or very pale text on YAAW’s light background caused by macOS dark mode or a different Tcl/Tk build inheriting the foreground colour differently. A quick test would be:
- Click inside the apparently blank output area.
- Press ⌘A, then ⌘C.
- Paste into TextEdit.
Let me know and if this is indeed why you can't read the text, I'll change the code to stop relying on the platform’s inherited foreground and set both explicitly on the execution text widget - but I'll await your report first.
EDIT 2:
Rather than wait for feedback across timezones, the passive Execution and About text panes now set explicit foreground, background, cursor, and selection colours to avoid platform/theme contrast mismatches that may occur due to unexpected system settings.
And another cheap win since the X3DOM display now required the use of a html browser anyway - Gamut Viewer now asks iccgamut which was already generating the static gamut view info to also generate an independent X3DOM gamut model, now viewable via a new 3D Gamut browser button within the Profile Metrics panel.
V3.40.21 at git
Last edited:

 ) The only change that should have impacted macOS users was to do with the rendering of foreground and background colours which are now hard wired instead of assuming that the OS plays nicely with tkinter - but 3.40.21 went through several steps as it was finalized and I think that I may have inadvertently uploaded a development version by mistake at one stage. So to be safe, please download it again just in order to be certain. You will also see a number of changes in this version.