

Navigation
Install the app
How to install the app on iOS
Follow along with the video below to see how to install our site as a web app on your home screen.
Note: This feature may not be available in some browsers.
More options
You are using an out of date browser. It may not display this or other websites correctly.
You should upgrade or use an alternative browser.
You should upgrade or use an alternative browser.
[Tool] ChromIQ – a macOS and Windows GUI for ArgyllCMS printer profiling (v4.2.0)
- Thread starter itsab1989
- Start date
- Thread starter
- #572
itsab1989
Printing Ninja
- Joined
- Feb 11, 2026
- Messages
- 290
- Reaction score
- 136
- Points
- 80
- Printer Model
- Epson ET 8550, Canon Pro 300
@mavtop
It is not all of what you have requested but at least what I thought I could do really quick and would be helpful. Note that in the release section on GitHub the betas appear not in the correct order sometimes.
https://github.com/itsab1989/ChromIQ/releases/tag/v3.14.8-beta.14
It is not all of what you have requested but at least what I thought I could do really quick and would be helpful. Note that in the release section on GitHub the betas appear not in the correct order sometimes.
https://github.com/itsab1989/ChromIQ/releases/tag/v3.14.8-beta.14
- Thread starter
- #573
itsab1989
Printing Ninja
- Joined
- Feb 11, 2026
- Messages
- 290
- Reaction score
- 136
- Points
- 80
- Printer Model
- Epson ET 8550, Canon Pro 300
I will read everything in detail later. Reading the changelog of beta 14 I think it missed to give the option for the user whether to fallback to default chartread or not and only saves the measurement which it sadly did not before. I missed that sorry.
For clarification: this „like spotread“ request is something that is not already there in chartread for when you are using it in strip reading mode right? Or did I just not notice it?
Some of the fundamentals are there (try using patch by patch mode to see that you can select individual patches - it just does not have the averaging and is slow in general).
For the glossy thing in build profile tab I am not the right person to answer I guess
For clarification: this „like spotread“ request is something that is not already there in chartread for when you are using it in strip reading mode right? Or did I just not notice it?
Some of the fundamentals are there (try using patch by patch mode to see that you can select individual patches - it just does not have the averaging and is slow in general).
For the glossy thing in build profile tab I am not the right person to answer I guess
mavtop
Printing Ninja
- Joined
- Nov 14, 2021
- Messages
- 151
- Reaction score
- 42
- Points
- 90
- Printer Model
- Epson XP 15000
ok now it shows the previously scanned patches, it is perfectI will read everything in detail later. Reading the changelog of beta 14 I think it missed to give the option for the user whether to fallback to default chartread or not and only saves the measurement which it sadly did not before. I missed that sorry.
For clarification: this „like spotread“ request is something that is not already there in chartread for when you are using it in strip reading mode right? Or did I just not notice it?
Some of the fundamentals are there (try using patch by patch mode to see that you can select individual patches - it just does not have the averaging and is slow in general).
For the glossy thing in build profile tab I am not the right person to answer I guess
- Thread starter
- #575
itsab1989
Printing Ninja
- Joined
- Feb 11, 2026
- Messages
- 290
- Reaction score
- 136
- Points
- 80
- Printer Model
- Epson ET 8550, Canon Pro 300
@mavtop
Please try if Check and Refine is now what you expect:
https://github.com/itsab1989/ChromIQ/releases/tag/v3.14.8-beta.16
Please try if Check and Refine is now what you expect:
https://github.com/itsab1989/ChromIQ/releases/tag/v3.14.8-beta.16

Alan G
Fan of Printing
- Joined
- Jul 15, 2017
- Messages
- 50
- Reaction score
- 43
- Points
- 62
- Location
- Bethesda, Maryland
- Printer Model
- Canon Pro-1000
Matte as plain paper is a non-reflective surface. I've read a bunch of your earlier posts and it looks like your i1 Pro spectros are either bad or the USB connection is problematic. I have an i1 Pro Rev D that is over 10 years old and have done a bunch of beta testing on earlier versions of this software. I don't need all the bells and whistles that are currently under discussion. I have had no issues at all in creating charts, printing, reading and making profiles. I've done about 15 different runs to test for bugs to report back to Sebastian.I have a question for you guyes, when i go to the Build Profile,
i can build for Glossy or Matte paper, but if i create a profile for a plain paper, which one should i choose ?
For all my use needs the stable build version 3.13.1. this works extremely well if all you need to do is create great profiles for your printer. @pharmacist created a good target with lots of near normals that works as well as doing the old two step process with a pre-condition profile.
Unless you have a specific use case, the current stable versions will do a great job.
Last edited:
- Thread starter
- #577
itsab1989
Printing Ninja
- Joined
- Feb 11, 2026
- Messages
- 290
- Reaction score
- 136
- Points
- 80
- Printer Model
- Epson ET 8550, Canon Pro 300
another good feature would be the fact of choosing with the mouse a single patch and make a spotread (like argyll tool) to read just the single patch several times and than average the values got, always if possible, so one can reread only the highest Delta-E patches.
Thinking about this I figured that chartread already offers a patch by patch mode with the -p option.
This is also available in the measure tabs manual module for the user to select.
Actually earlier this week I tried this out the first time myself because I wanted to check how the selection and overlay are working in the measure engine. After implementing some fixes it basically works as you describe and one can simply click any patch on the chart and it gets selected as the one the user should measure.
2 things though that I don’t know:
1. if you can read the whole chart like you would always do in regular strip mode and then only for remeasuring enable patch by patch for single patches - that part you could simply try
2. the averaging part. I am not sure if this mode takes only a single reading for every patch or if it takes multiple readings like in strip mode and then averages them. I would have to ask Claude about this
- Thread starter
- #578
itsab1989
Printing Ninja
- Joined
- Feb 11, 2026
- Messages
- 290
- Reaction score
- 136
- Points
- 80
- Printer Model
- Epson ET 8550, Canon Pro 300
Hello guys!
I am at the airport right now and my flight is taking off in a few hours.
But I just wanted to let you know that Knut was working on some convenience features in the last few beta versions like custom sounds for different events during measurement and an indicator for whether you are reading the strips slow enough for the device to get a good measurement or not.
So if you feel like it maybe give it a try and report back while I‘ll be lying at the pool
https://github.com/itsab1989/ChromIQ/releases/tag/v4.0.0-beta.3
I am at the airport right now and my flight is taking off in a few hours.
But I just wanted to let you know that Knut was working on some convenience features in the last few beta versions like custom sounds for different events during measurement and an indicator for whether you are reading the strips slow enough for the device to get a good measurement or not.
So if you feel like it maybe give it a try and report back while I‘ll be lying at the pool
https://github.com/itsab1989/ChromIQ/releases/tag/v4.0.0-beta.3
Last edited:
- Thread starter
- #579
itsab1989
Printing Ninja
- Joined
- Feb 11, 2026
- Messages
- 290
- Reaction score
- 136
- Points
- 80
- Printer Model
- Epson ET 8550, Canon Pro 300
Since I am turning 37 today I have a little present for you (well I guess we will see if it is a present or curse  ).
).
During the last few weeks a lot of work has been done and thanks to Knut ChromIQ has received some new features and bug fixes that we think earned the app the jump to version 4.0.0.
https://github.com/itsab1989/ChromIQ/releases/tag/v4.0.0
So what is new in this?




Probably there are more things that I have forgotten to mention. Let me know what you think!
And as always: Thanks a lot for everything Knut!
The only thing I will be testing today is this:

https://github.com/itsab1989/ChromIQ/releases/tag/v4.0.0
).During the last few weeks a lot of work has been done and thanks to Knut ChromIQ has received some new features and bug fixes that we think earned the app the jump to version 4.0.0.
https://github.com/itsab1989/ChromIQ/releases/tag/v4.0.0
So what is new in this?
- Knut designed a better system for the file management of ChromIQ. It now has a bar where you can select whether you want to do a profiling or verification run inside your projects and create new runs for each type. You can go back and forth between those types and runs and should be able to always find the work you have done. Nothing is lost and each run saves the settings you chose for it.
- Measurements were improved and with our ChromIQ chartreading engine you now have the option to let the app play sounds on some events and you can customize those sounds if you want to.
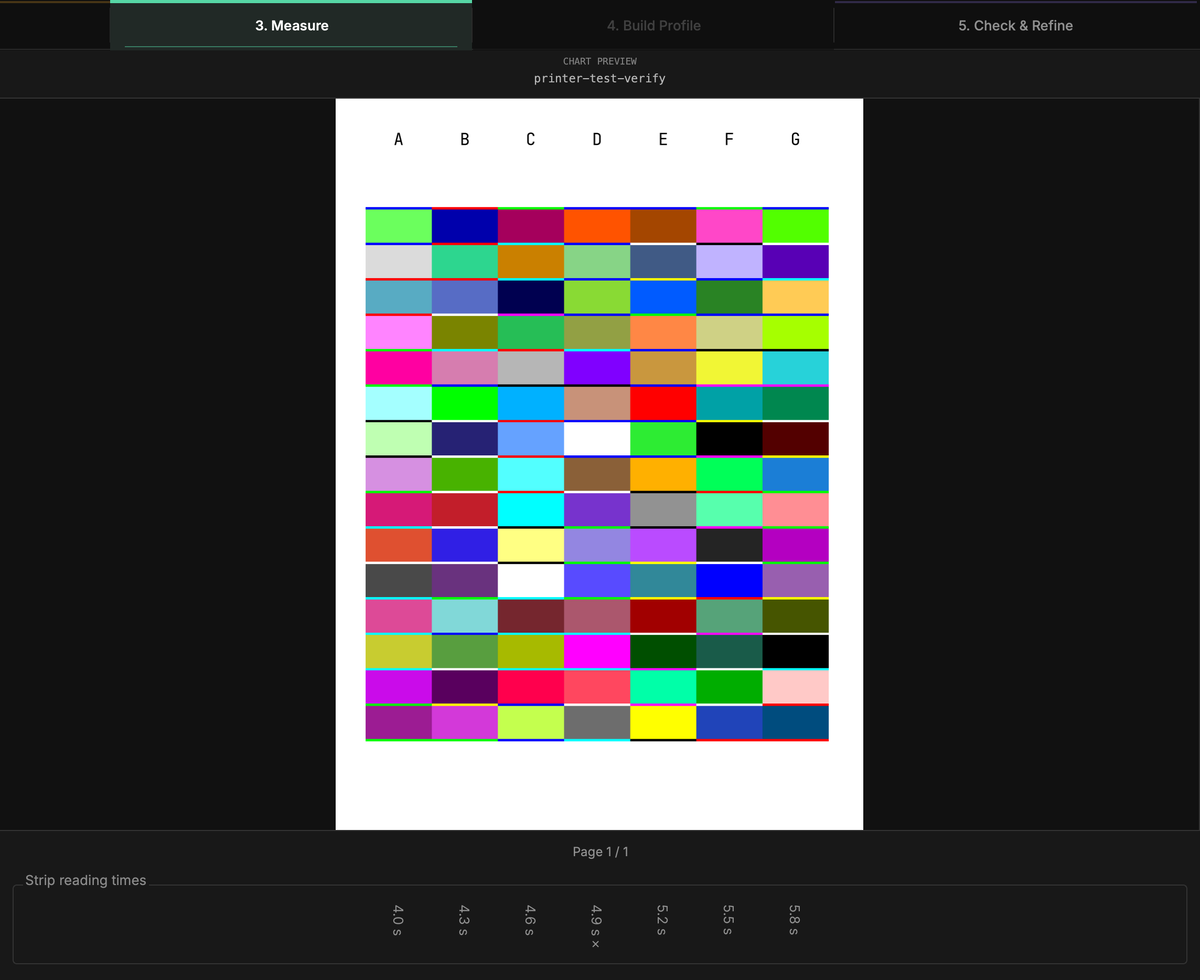
- ChromIQ will now also tell you how fast you have been reading a strip and suggest you to slow down if it notices that you were reading too fast. Hopefully this will improve the measurement experience for beginners.
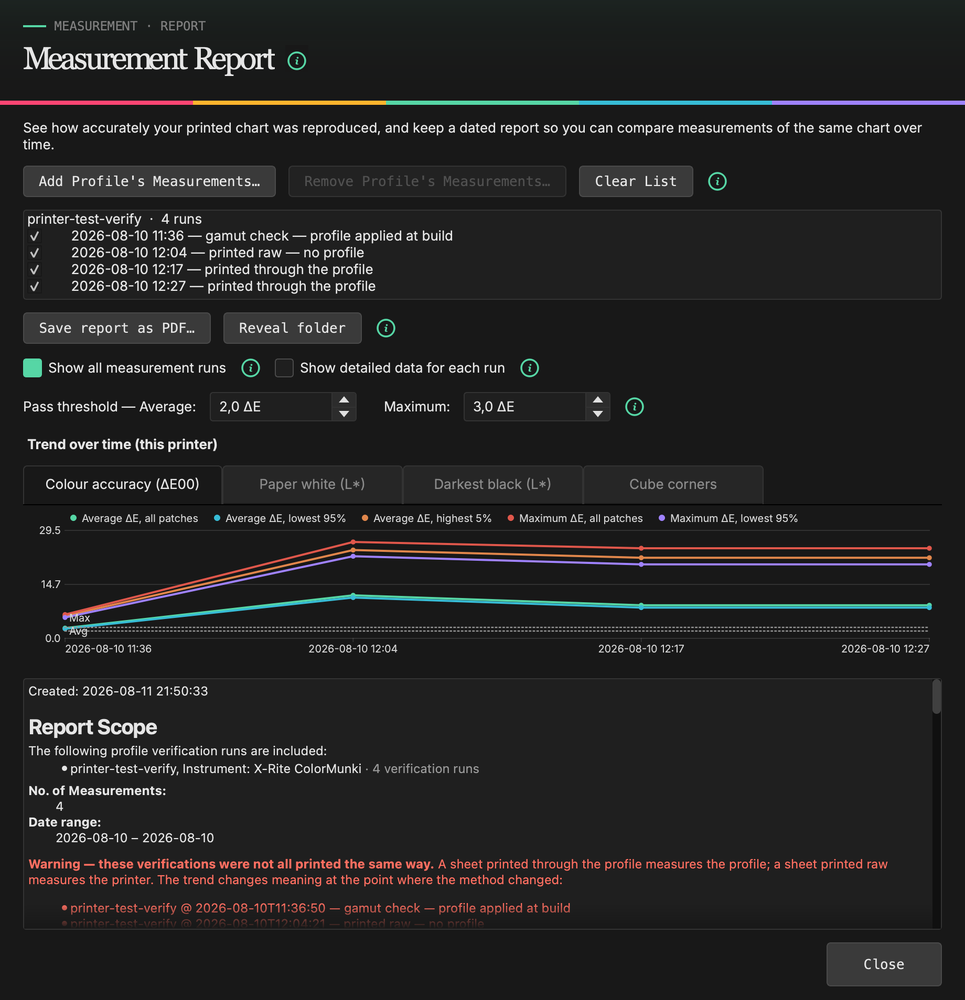
- I already mentioned verification runs. Because of a request from Katrina ChromIQ now offers to create a chart based on the ICC profile you have created. Set the run type to verification and the create chart tab offers a new module „From Profile Gamut“. From a master set of patches this tells you how many of those safely fit inside the gamut of the ICC profile for your printer / paper combination. Out of those you can select any number you want and do a verification run based on this. Note: the exact workflow needs some testing - verifying the verification so to say.
- A lot of other smaller and bigger changes like:
- the measurement report tool received an overhaul to comply with the new verification features
- some cosmetic changes like new icons, adjusted button positions, changeable log output size (or hide it completely)
- some new presets from Red River Paper for their customers
- lots of bug fixes (if you find more of them feel free to keep them )
Probably there are more things that I have forgotten to mention. Let me know what you think!
And as always: Thanks a lot for everything Knut!
The only thing I will be testing today is this:
https://github.com/itsab1989/ChromIQ/releases/tag/v4.0.0
Last edited:
Alan G
Fan of Printing
- Joined
- Jul 15, 2017
- Messages
- 50
- Reaction score
- 43
- Points
- 62
- Location
- Bethesda, Maryland
- Printer Model
- Canon Pro-1000
@itsab1989 - Happy Birthday!!!! Mine is coming up near the end of the month.
Mine is coming up near the end of the month.

