- Joined
- Dec 27, 2014
- Messages
- 6,344
- Reaction score
- 7,561
- Points
- 373
- Location
- Germany
- Printer Model
- L805, WF2010, ET8550, T3100X
I made another test to compare profiles with based on different patch sheet counts and the impact onto actual prints.
I did this -
- I created several icc-profiles with 96 - 283 -720 - 1440 - 2880 color patches onto the same paper type, a glossy cast coated 210 gr paper by the Action thrift shop.
- I used these profiles and printed a patch sheet with 450 patches - the same patch sheet with the same printer setting - rel col rendering intent and no Black Point Compensation with the different profiles. . I used a patch sheet and not a regular image to compare because I let 1Profiler do the print comparisons and do the statistical values.
- I scanned these 5 sheets and let i1Profiler do the comparison of the scanned patch sheet data - aways against that profile created with 2880 patches.
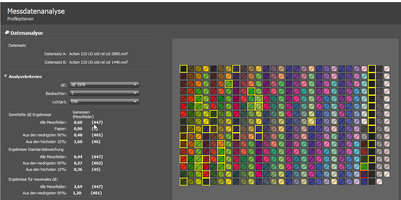
The software compares all thes 450 patches and calculates the average DeltaE for all of them
DeltaE = 0.60 for the comparison of a profile created with 2880 vs. 1440 patches

The program displays as well the max peak value of an individual patch, in this case 2.69 .
DeltaE = 0.91 for a profile from 720 vs. 2880 patches
DeltaE = 1.0 for a profile from 283 vs. 2880 patches
DeltaE = 1.4 for a profile from 96 vs. 2880 patches
96 patches fit easily on a 4 x 6 inch paper sheet, 96 patches appear to be enough in comparison to 2880 patches to create a profile with such small deviations.
This 450 patchcount sheet is printed via a profile which does quite some changes to the actual color values - based on the rendering intent how out of gamut colors are reassigned to color values inside the printer gamut or on the edge of it.
This becomes visible with the Gamutvision program

The screen copy displays both the sRGB gamut and the printer gamut inside of it. Attention is drawn to the lower part of the display - showing some small light arrows pointing from the surface of the sRGB gamut to some points on the boundary of the printer gamut. All colors outside the printer gamut are remapped to colors on the printer gamut as the vectors show, and these vectors have a different direction if you choose another rendering intent. It is apparent that the color saturation and hue changes are significant, these changes are much wider than the small changes between the number of color patches used for the profile generations in this test.
It is my conclusion that I'm already getting quite a good profile just with 96 color patches which does not differ much from a profile created with 2880 patches.
I did this -
- I created several icc-profiles with 96 - 283 -720 - 1440 - 2880 color patches onto the same paper type, a glossy cast coated 210 gr paper by the Action thrift shop.
- I used these profiles and printed a patch sheet with 450 patches - the same patch sheet with the same printer setting - rel col rendering intent and no Black Point Compensation with the different profiles. . I used a patch sheet and not a regular image to compare because I let 1Profiler do the print comparisons and do the statistical values.
- I scanned these 5 sheets and let i1Profiler do the comparison of the scanned patch sheet data - aways against that profile created with 2880 patches.
The software compares all thes 450 patches and calculates the average DeltaE for all of them
DeltaE = 0.60 for the comparison of a profile created with 2880 vs. 1440 patches

The program displays as well the max peak value of an individual patch, in this case 2.69 .
DeltaE = 0.91 for a profile from 720 vs. 2880 patches
DeltaE = 1.0 for a profile from 283 vs. 2880 patches
DeltaE = 1.4 for a profile from 96 vs. 2880 patches
96 patches fit easily on a 4 x 6 inch paper sheet, 96 patches appear to be enough in comparison to 2880 patches to create a profile with such small deviations.
This 450 patchcount sheet is printed via a profile which does quite some changes to the actual color values - based on the rendering intent how out of gamut colors are reassigned to color values inside the printer gamut or on the edge of it.
This becomes visible with the Gamutvision program
The screen copy displays both the sRGB gamut and the printer gamut inside of it. Attention is drawn to the lower part of the display - showing some small light arrows pointing from the surface of the sRGB gamut to some points on the boundary of the printer gamut. All colors outside the printer gamut are remapped to colors on the printer gamut as the vectors show, and these vectors have a different direction if you choose another rendering intent. It is apparent that the color saturation and hue changes are significant, these changes are much wider than the small changes between the number of color patches used for the profile generations in this test.
It is my conclusion that I'm already getting quite a good profile just with 96 color patches which does not differ much from a profile created with 2880 patches.
Last edited:
