Profile Assessment

RogerB

Print Addict
Joined
Sep 27, 2010
Messages
293
Reaction score
315
Points
183
Location
S.E. England
Printer Model
Epson Pro3880
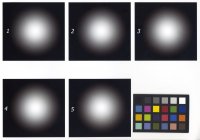
The problem I have with it is that there is no absolute reference. If the scanner can be relied on to produce accurate L*a*b* results then it's OK; but how do you know if the results are accurate? If I scan my reference print, using the scanner's default profile, it looks like this:-
LCC_Scan.jpg
Seen in isolation, on a purely subjective basis, it looks pretty good. However, if you look at it beside the actual reference image it looks like this (reference at the top):-
LCC_Comparison.jpg
Even using the eye-dropper in PS you can see that for some of the patches the differences between the scanned image and the reference are much too large to be useful. The fact is that unless your scanner is well profiled the accuracy is unlikely to be better than that of your printer for these in-gamut colours.
 

Emulator

Printer Master
Platinum Printer Member
Joined
Jan 4, 2012
Messages
1,675
Reaction score
1,308
Points
277
Location
UK
Printer Model
Canon Pro9000 II
I see what you mean. Looking at it through all the processing of the web, it looks as though the L* values of the top row are all a little higher, except for the greyscale patches on the left which appear lower. Is that with or without scanner profiling?

I bought a copy of Abhay Sharma's "Understanding Color Management" and am gradually reading through it. It sets you thinking.

It occurred to me that as I have ColorMunki Photo and a Xrite Color Checker card, I may be able to use this by means of the built-in ColorMunki camera profiling capability, to create a profile for a scanner as well.

Incidentally, you don't need to trick CM, to allow time delayed profile patch reading, there is provision for it built in, as there is sRGB and L*a*b* numerical patch evaluation. I have tried creating profiles from the original profiling charts, three months later and the comparison was interesting, quite noticeable colour drift as the patch print had matured. I protect all old charts by stacking to keep light and air out.

Looking over the gradient test processing sequence, I noticed that the original gradient image file showed slight stepping rings in the monitor displayed image (iiyama LCD, CM profiled display). This image was, you may remember, converted from B&W to sRGB to allow Gamutvision to accept it. Seeing the stepping I converted the image to AdobeRGB and the faint steps disappeared almost completely. As all the profiles were produced for AdobeRGB, it means I should go over the whole process again!
 

RogerB

Print Addict
Joined
Sep 27, 2010
Messages
293
Reaction score
315
Points
183
Location
S.E. England
Printer Model
Epson Pro3880
I see what you mean. Looking at it through all the processing of the web, it looks as though the L* values of the top row are all a little higher, except for the greyscale patches on the left which appear lower. Is that with or without scanner profiling?
It's not just the L* - there are big errors in a* and b* too. This scanner is not profiled. It's very rarely used for photo work and when it is it's perfectly acceptable for "snapshot" scanning.
It occurred to me that as I have ColorMunki Photo and a Xrite Color Checker card, I may be able to use this by means of the built-in ColorMunki camera profiling capability, to create a profile for a scanner as well.
Good luck with that but I'm not sure you would get a very good profile with only 24 colour patches.
Incidentally, you don't need to trick CM, to allow time delayed profile patch reading, there is provision for it built in, as there is sRGB and L*a*b* numerical patch evaluation. I have tried creating profiles from the original profiling charts, three months later and the comparison was interesting, quite noticeable colour drift as the patch print had matured. I protect all old charts by stacking to keep light and air out.
I had forgotten that the CM had a patch reading function. I would say that was the best way to check your profile accuracy. Generate a target with a range of colours, print it and measure the L*a*b* values. I would much sooner trust the CM readings than anything from a scanner, profiled or not. As for delaying readings I thought that was for the second set of patches, but I'm really not familiar with the CM software, whereas you obviously are.
Looking over the gradient test processing sequence, I noticed that the original gradient image file showed slight stepping rings in the monitor displayed image (iiyama LCD, CM profiled display). This image was, you may remember, converted from B&W to sRGB to allow Gamutvision to accept it. Seeing the stepping I converted the image to AdobeRGB and the faint steps disappeared almost completely.
I think that may be an artifact of the Adobe conversion engine. sRGB doesn't have a pure gamma curve but has a change of slope around 14 (r=g=b) I believe. This has been noted as producing spikes in the histogram of a converted image.
As all the profiles were produced for AdobeRGB, it means I should go over the whole process again!
Not sure what you mean here. Where does the AdobeRGB colour space come in?
 

Emulator

Printer Master
Platinum Printer Member
Joined
Jan 4, 2012
Messages
1,675
Reaction score
1,308
Points
277
Location
UK
Printer Model
Canon Pro9000 II
Not sure what you mean here. Where does the AdobeRGB colour space come in?

You are right it doesn't. It was just that I could see a very slight difference on the monitor, looking at the two image files, which I should not have. Still unexplained, checked the images with Gamutvision in all the modes and can't see any difference.
 
Last edited:

Emulator

Printer Master
Platinum Printer Member
Joined
Jan 4, 2012
Messages
1,675
Reaction score
1,308
Points
277
Location
UK
Printer Model
Canon Pro9000 II
These images made from the black to white 360 degree radial gradients, printed on the eight IS ink Canon 9000 II printer, through the five ColorMunki profiles (the primary profile and four optimisations) were tests to determine B&W image quality of CM optimised profiles. I stated in post#56 that I would advise the order of the profiles shown. They are in fact, in the order Roger has numbered them, 1 is the primary profile and 2,3,4,5 are the optimised profiles in the order produced (see post #19). There seems to be little difference between them, but 5 does seem to show faint rings. I suspect it would be unlikely that in a normal image anything would be noticeable.


Multicirc2.JPG

The second block of six coloured images shows the effect of the profiles on a combined coloured and B&W test chart. The sequence of profiles, top left to right, are CM primary, Argyll, CM optimisation 1, lower row left to right, CM optimisation 2,3 and 4.
 
Last edited:

RogerB

Print Addict
Joined
Sep 27, 2010
Messages
293
Reaction score
315
Points
183
Location
S.E. England
Printer Model
Epson Pro3880
The second block of six coloured images shows the effect of the profiles on a combined coloured and B&W test chart. The sequence of profiles, top left to right, are CM primary, Argyll, CM optimisation 1, lower row left to right, CM optimisation 2,3 and 4.
Like the composite target! It's very revealing.

I would still choose the original CM profile as the best. The Argyll is disappointing - very nasty red region in the grey gradient. How many patches did you use for this? The CM iterations do seem to get a bit worse, with banding appearing in the yellow region and becoming very obvious in the final iteration.
 

Emulator

Printer Master
Platinum Printer Member
Joined
Jan 4, 2012
Messages
1,675
Reaction score
1,308
Points
277
Location
UK
Printer Model
Canon Pro9000 II
A certain caution is necessary when assessing the results. Apart from the paper and ink used, which in all these cases is the Sihl glossy 280g/sm and IS dye ink for Canon Pro 9000 II, the printer's own "paper" profile choice for printing the targets and the test images and the externally created printer profiles (the subjects of the exercise), all have an effect on the results.

In the absence of a scanner, the method of conversion of the printed image for the website uploadable image (jpeg from the original RAW image), will be a Canon SLR (also profiled with CM and the Xrite Colour Checker) and this may also influence the results. The illumination colour temperature, in this case daylight, is also variable.

The original test image (click to enlarge) is shown here. It also has been converted to jpeg from tiff, to enable the web upload.
Multi.jpg
It says something for the existing state of colour management available to us, that the results are as recognisable as they are!

I am in process of preparing images of the test target, printed on the Sihl paper, in three Canon paper profile types, Paper Plus Glossy II N, Paper Pro II and Paper Pro Platinum. I am letting the print mature for 24 hours (another factor which makes a considerable difference).
 
Last edited:

RogerB

Print Addict
Joined
Sep 27, 2010
Messages
293
Reaction score
315
Points
183
Location
S.E. England
Printer Model
Epson Pro3880
The illumination colour temperature, in this case daylight, is also variable.
Interesting. Looking at the Argyll result again, it looks like a severe case of color inconstancy. The red cast in the greyscale gradient is typical of a dye ink when viewed in tungsten illumination (Illuminant A). Was the Argyll profile generated for D50 illumination, and was your "daylight" really D50 daylight? As you say,the illuminant is definitely a variable.
 

Emulator

Printer Master
Platinum Printer Member
Joined
Jan 4, 2012
Messages
1,675
Reaction score
1,308
Points
277
Location
UK
Printer Model
Canon Pro9000 II
Come to think of it, on that print the illuminant was your scanner!
 
Last edited:
Top