Profile Assessment

Roy Sletcher

Indolent contrarian
Platinum Printer Member
Joined
Dec 20, 2010
Messages
978
Reaction score
1,007
Points
233
Location
Ottawa, CANADA
Printer Model
Canon Pro-100, and Epson 3880
On the question of ColorMunki optimisations, the gamut volumes of the 5 versions of the profile according to Gamutvision are:-

Colorimetric Gamut Volumes in L*a*b* volume units (Delta E^3)
Primary profile 664573
Optimisation (1) 679383
Optimisation (2) 680726
Optimisation (3) 682676
Optimisation (4) 679992

The volume of Adobe RGB 1998.icc in the same units is 1225088.

All but the last increased the volume. The last image used was a scene of green grass and trees with many wild flowers of different colours and a grey wooden seat (see post #19 for details of other optimisation images). This reduced the volume, but a trial print of the image looked fine. So my conclusion that ColorMunki optimisations beyond the second are effective, is I think justified.

Was this increased gamut volume visible in the print, or monitor if a monitor profile?

RS
 

Emulator

Printer Master
Platinum Printer Member
Joined
Jan 4, 2012
Messages
1,675
Reaction score
1,308
Points
277
Location
UK
Printer Model
Canon Pro9000 II
Was this increased gamut volume visible in the print, or monitor if a monitor profile?

Hi Roy,

The noticeable difference in the prints is the colour correction not the gamut size, which is only 2.7% at most. The reason I quoted the values was to show that multiple CM optimisations, beyond two, have an effect, even reducing the gamut volume as in the last optimisation, which I suspect, moderated the greens.

Emu
 
Last edited:

Emulator

Printer Master
Platinum Printer Member
Joined
Jan 4, 2012
Messages
1,675
Reaction score
1,308
Points
277
Location
UK
Printer Model
Canon Pro9000 II
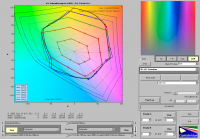
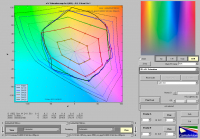
I have replaced the two images with 2D a* b* Saturation Maps. The first image being the primary profile and the second image the 4th optimisation profile. Comparing the two, although the overall profile gamut volume is less, the saturation levels 0.6 to 1.0 in the blue/magenta area have been extended.

Primary Saturation Map.pngOption 4 Saturation Map.png

Incidently I came across a good Xrite PDF which explains all aspects of colour definition and display at:
http://www.xrite.com/documents/literature/en/L10-001_Understand_Color_en.pdf
 
Last edited:

RogerB

Print Addict
Joined
Sep 27, 2010
Messages
293
Reaction score
315
Points
183
Location
S.E. England
Printer Model
Epson Pro3880
Hi Roy,

The noticeable difference in the prints is the colour correction not the gamut size, which is only 2.7% at most. The reason I quoted the values was to show that multiple CM optimisations, beyond two, have an effect, even reducing the gamut as in the last optimisation, which I suspect, moderated the greens.

Emu
Since you are using Gamutvision have you used "Analyze simulated colorchecker" to compare the profiles? My first port of call when I generate a new profile is the 3D gamut plot (with rendering set to "None"), but only to make sure there are no obvious gaps or bumps in the intrinsic gamut of the printer. However, because I am more interested in colour accuracy than colour gamut volume I then go straight to Analyze simulated colorchecker. I have found that the predicted errors from Analyze simulated colorchecker, with Colorimetric rendering, generally give me a very good indication of the quality of the profile. If I want even more confidence I will print my own version of the Colorchecker and measure the individual patches or simply compare them visually with my know reference print. Having done this scores of times I have a pretty high confidence in the simulation.
 

Emulator

Printer Master
Platinum Printer Member
Joined
Jan 4, 2012
Messages
1,675
Reaction score
1,308
Points
277
Location
UK
Printer Model
Canon Pro9000 II
Hi Roger,

Yes, I have looked at the simulated GretagMacbeth ColorChecker, in fact there are so many different options in Gamutvision, that it will take a long time to try them all. At the moment I am trying to determine what ColorMunki does with its multiple Optimisation processes.
 
Last edited:

Emulator

Printer Master
Platinum Printer Member
Joined
Jan 4, 2012
Messages
1,675
Reaction score
1,308
Points
277
Location
UK
Printer Model
Canon Pro9000 II
Hi RogerB,

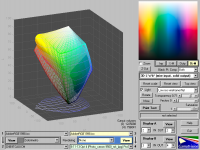
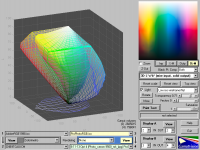
I have started to look at your recommended assessment procedure in post #34. I am using the CM fourth optimisation profile and here are two images of 3D L*a*b* (wire input, solid output) with rendering intent set to "None". The first using Adobe RGB1998 as the colour space and we can see the profile gamut, in some areas, exceeds the Adobe colour space, with no rendering intent set. The second image is using ProPhotoRGB colour space and the CM profile with no rendering intent, is contained within the colour space.
Opt4withAdobe.pngOpt4withProPhoto.png

Are these as you would have expected? I will now have a look at the simulated colorchecker.
 

Emulator

Printer Master
Platinum Printer Member
Joined
Jan 4, 2012
Messages
1,675
Reaction score
1,308
Points
277
Location
UK
Printer Model
Canon Pro9000 II
@RogerB
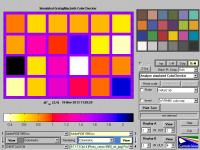
This is the result of the colorchecker test with colorimetric intent. The printer is a Canon 9000 II, incidentally. Don't be misled by the reference to the 9500, in the profile name, that was a 9500 image file, used in the 4th CM optimisation.
ColorcheckerOpt4 9000II.png
It seems that Delta E ab values are all reasonably low.

P.S. For those unfamiliar with the Gamutvision colour checker test page, to read the Delta E ab, colour error values, compare the colour patches in the main image block with the strip below, which has an error value calibration.

In this image, the range is 0 to 2 (the range changes according to the image requirement). Thus the top, left hand corner patch would be about Delta E ab = 0.9

The smaller image, top right, shows the true colours of the profile output.
 
Last edited:

RogerB

Print Addict
Joined
Sep 27, 2010
Messages
293
Reaction score
315
Points
183
Location
S.E. England
Printer Model
Epson Pro3880
That all looks very familiar! The gamut plots look OK with no nasty irregularities and the Grainger rainbow image doesn't show any banding or holes. Of course the gamut plot with no rendering just shows the maximum colour gamut of the printer. There's not much you can do about this unless you can change the ink loading, but I suspect the only way you could do that is to change the media setting.

The Delta E values are very acceptable and they would be even lower if you turned off black point compensation. BPC has a small but noticeable effect on everything from mid-tones downwards. As you are looking at the effect of optimisation it would be interesting to compare the simulation with different versions of the profile. Does the optimisation actually improve the colour accuracy?

If you are interested in B&W printing the B&W density response plot can be quite revealing, especially if you are trying to optimise the greyscale performance. Not only will it show you the Dmax and linearity but will also show any colour casts through the tonal range. I would expect optimised profiles to give lower a* and b* values here, always difficult to achieve with a printer that has only one black.

Gamutvision is a great tool (and plaything!) and you can learn a lot from it. But, of course, the real test is when you come to print. The Colorchecker is useful here because the colours should all be within the printer gamut and should print accurately. I print my own version which is in a linear format so can be printed in the margin of a profiling target - kind of closes the loop! If you want to try it you can find it here http://www.hermitage-ps.co.uk/downloads.htm (If you don't have a Colorchecker PM me and I will send you a reference strip.)
 

Emulator

Printer Master
Platinum Printer Member
Joined
Jan 4, 2012
Messages
1,675
Reaction score
1,308
Points
277
Location
UK
Printer Model
Canon Pro9000 II
Many thanks Roger for the comments, I will follow up these and look at the 5 profiles "Delta E" in comparison. I will also examine the effect of BPC on the darker Delta E values.

I have a Xrite ColorChecker card, which came with the ColorMunki Photo as a free extra! I have used it to profile my Canon 500D and 7D. I could take a photo of it and produce an image file, but I suspect a better way would be to use the patch values (they are on the web) and create a strip file in PS Elements, to suit the varying requirements.

An interesting website, in fact, I used one of your the optimiser images as the source image for the third CM optimisation, see post #19!

Regards
Ian
 

RogerB

Print Addict
Joined
Sep 27, 2010
Messages
293
Reaction score
315
Points
183
Location
S.E. England
Printer Model
Epson Pro3880
I suspect a better way would be to use the patch values (they are on the web) and create a strip file in PS Elements, to suit the varying requirements.
The last file (CC24) on my Downloads page is just that.
 
Top