

Printer Profile Validation: M1 vs. M2 and ΔE2000 Evaluation

Project: CP1500-624p

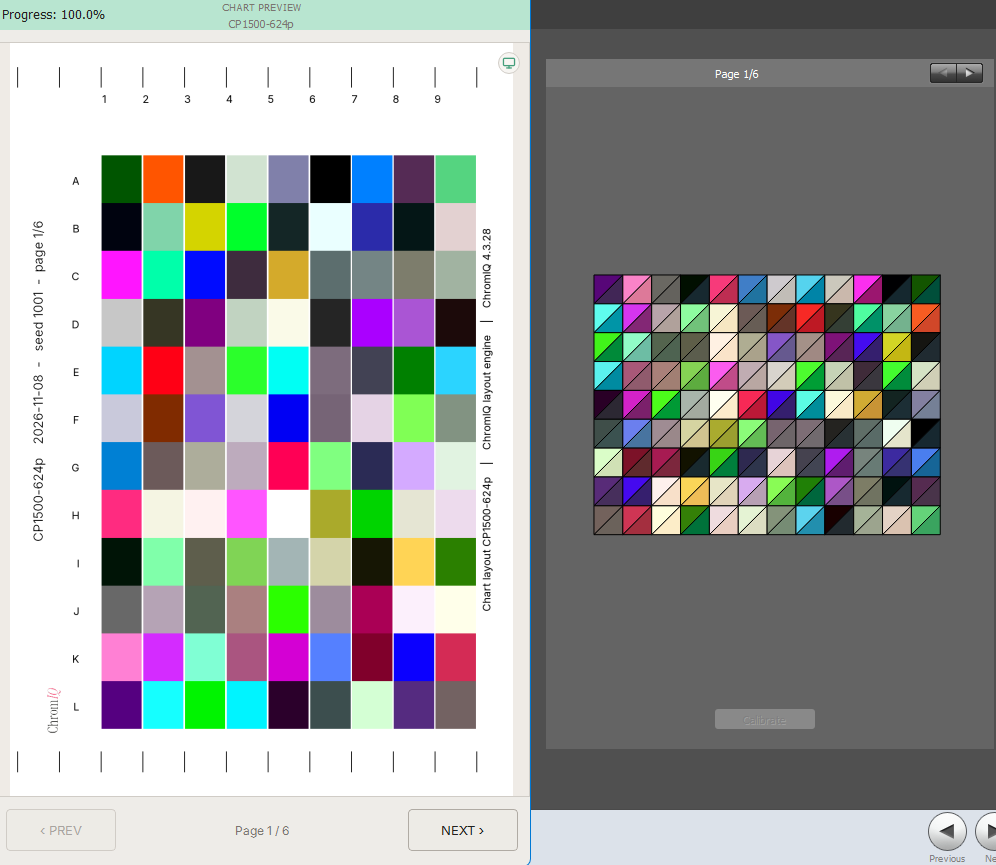
Left image: ChromIQ
Right image: i1Profiler
1794186549560.png


1. Randomization Test: Pass

2. Swapping Strip and Row Numbering Sequences Test: Pass

3. Multi-Page Layouts Test: Fail

Not all multi-page layouts can be processed by ChromIQ.

i1Profiler inserts additional patches to fill empty rows, which can cause compatibility issues. I am confident that this limitation can be addressed in the next release.


ZIP:
CP1500-624p(1page)-P.mxf
CP1500-624p(6pages)-P.mxf
CP1500-624p(52pages)-F.mxf
CP1500-624p(18pages)-F.mxf
 

Attachments

If it can figure out a solution an update should be ready in 24h I hope
 
@jctay thank you very much for the files and the careful testing, they helped a lot. ChromIQ 4.3.29 is out now: https://github.com/itsab1989/ChromIQ/releases/tag/v4.3.29

What we found in your files
  • Randomisation and the strip numbering both work as intended, nothing to change there.
  • i1Profiler does not insert extra patches into the measurement. All four files hold exactly the same 624 patches, with no fillers, and the readings in the 18-page and 52-page files are identical to the 6-page file, to the last digit. What happened is this: after measuring, the page settings in i1Profiler (Page setup on the Test Chart page, such as the paper size) were changed and the measurement was saved again. i1Profiler then rearranges the readings it already has onto the new pages, so every reading still belongs to its own patch, but the file now shows a grid of 4 or 3 columns instead of the 12 the how-to note asks for.
  • ChromIQ still refuses such a file, on purpose: from the file alone it cannot tell "measured correctly, rearranged afterwards" apart from "measured on the wrong grid", and in the second case the readings would sit on the wrong patches of your profile. But the old message wrongly said the readings had been taken on the wrong patches. That was not true for your files, sorry for the confusion.

What 4.3.29 changes
  • The message for this case now explains both possibilities and how to fix the first one without measuring again: open the measurement in i1Profiler (Load under Page Data on the Measurement page), go back to the Test Chart page, set Page setup back to the paper size you measured with until i1Profiler shows the 12 columns again, save it as an .mxf once more and import that file. We tried this in i1Profiler with your 18-page file: it showed the 12 columns again and ChromIQ imported all 624 readings, identical to your 6-page file. When ChromIQ then asks which measurement condition to import, please check that the one you want is selected, because i1Profiler may change the one it marks as chosen when you save again.
  • The how-to note has a new line under step 7 that says the same: leave i1Profiler's page settings as they were while you measured, also when you open the measurement again later.
  • While looking at your files we found a real bug: on a computer that writes numbers with a decimal comma (for example one set to German), i1Profiler saves its measurements as "0,056192" instead of "0.056192", and ChromIQ refused the whole file as "not a number". Such files are now read correctly.
  • On a chart with numbered strips, the how-to note and the order file said "strip 1A" where your sheet says "1". They now use the same name as the sheet.

For Windows users
Someone reported that an antivirus program flagged 4.3.28. We checked that release: it was built by GitHub from the published source code and nothing in it is harmful. It is a known false alarm that hits many programs packed with PyInstaller. 4.3.29 is now built in a way that should make this less likely (the small starter program is compiled from source in our own build, every download in the build is checked against a fixed fingerprint, and the build starts the finished app once to check it). It cannot rule a false alarm out completely, because ChromIQ is not signed with a paid certificate. If your antivirus still reports it, please tell me the name of the detection it shows.

One small test, if you have five minutes
Could you try whether i1Profiler lets you scan one 12-patch strip of the turned chart when it shows a different number of columns than 12? For example: set Page setup so that i1Profiler shows 4 columns, and try to scan the first strip of your printed sheet in one pass. If i1Profiler refuses it or asks you to scan a row of 4 patches instead, the 12 columns of step 5 are really needed and ChromIQ's check stays as it is. If it accepts the 12 patches in one pass, please tell me, then we will look at whether ChromIQ can accept more grids.

Thanks again!
 
@jctay thank you very much for the files and the careful testing, they helped a lot. ChromIQ 4.3.29 is out now: https://github.com/itsab1989/ChromIQ/releases/tag/v4.3.29

What we found in your files
  • Randomisation and the strip numbering both work as intended, nothing to change there.
  • i1Profiler does not insert extra patches into the measurement. All four files hold exactly the same 624 patches, with no fillers, and the readings in the 18-page and 52-page files are identical to the 6-page file, to the last digit. What happened is this: after measuring, the page settings in i1Profiler (Page setup on the Test Chart page, such as the paper size) were changed and the measurement was saved again. i1Profiler then rearranges the readings it already has onto the new pages, so every reading still belongs to its own patch, but the file now shows a grid of 4 or 3 columns instead of the 12 the how-to note asks for.
  • ChromIQ still refuses such a file, on purpose: from the file alone it cannot tell "measured correctly, rearranged afterwards" apart from "measured on the wrong grid", and in the second case the readings would sit on the wrong patches of your profile. But the old message wrongly said the readings had been taken on the wrong patches. That was not true for your files, sorry for the confusion.

What 4.3.29 changes
  • The message for this case now explains both possibilities and how to fix the first one without measuring again: open the measurement in i1Profiler (Load under Page Data on the Measurement page), go back to the Test Chart page, set Page setup back to the paper size you measured with until i1Profiler shows the 12 columns again, save it as an .mxf once more and import that file. We tried this in i1Profiler with your 18-page file: it showed the 12 columns again and ChromIQ imported all 624 readings, identical to your 6-page file. When ChromIQ then asks which measurement condition to import, please check that the one you want is selected, because i1Profiler may change the one it marks as chosen when you save again.
  • The how-to note has a new line under step 7 that says the same: leave i1Profiler's page settings as they were while you measured, also when you open the measurement again later.
  • While looking at your files we found a real bug: on a computer that writes numbers with a decimal comma (for example one set to German), i1Profiler saves its measurements as "0,056192" instead of "0.056192", and ChromIQ refused the whole file as "not a number". Such files are now read correctly.
  • On a chart with numbered strips, the how-to note and the order file said "strip 1A" where your sheet says "1". They now use the same name as the sheet.

For Windows users
Someone reported that an antivirus program flagged 4.3.28. We checked that release: it was built by GitHub from the published source code and nothing in it is harmful. It is a known false alarm that hits many programs packed with PyInstaller. 4.3.29 is now built in a way that should make this less likely (the small starter program is compiled from source in our own build, every download in the build is checked against a fixed fingerprint, and the build starts the finished app once to check it). It cannot rule a false alarm out completely, because ChromIQ is not signed with a paid certificate. If your antivirus still reports it, please tell me the name of the detection it shows.

One small test, if you have five minutes
Could you try whether i1Profiler lets you scan one 12-patch strip of the turned chart when it shows a different number of columns than 12? For example: set Page setup so that i1Profiler shows 4 columns, and try to scan the first strip of your printed sheet in one pass. If i1Profiler refuses it or asks you to scan a row of 4 patches instead, the 12 columns of step 5 are really needed and ChromIQ's check stays as it is. If it accepts the 12 patches in one pass, please tell me, then we will look at whether ChromIQ can accept more grids.

Thanks again!
Thank you 🍷


I'll use the well-known ColorChecker Classic (CC24) chart to illustrate this, as I already have the measurement data.

- As long as i1Profiler accepts the row/column combination after adjusting the relevant parameters (e.g. patch size, paper size, etc.), there should be no problem performing the measurement.

- However, if you change the layout to 5 × 5, i1Profiler inserts a filler patch during measurement to fill the remaining space. This filler patch may not be included in the resulting .mxf file.

i1Profiler Patch Layout
5x5 layout.png


i1Profiler Measurement
5x5 measurement.png


Can you freely set the number of columns in i1Profiler? The answer is no.

For example, the following row/column combinations are acceptable: 1 × 24, 2 × 14, and 5 × 5, but colum=23 is not.

Another example: When working with a 600-patch target (if I remember correctly), a column count of 13 works in ChromIQ but is not accepted by i1Profiler. i1Profiler is more comfortable with column counts of 12 or 14.

In general, i1Profiler allows you to measure whatever is displayed on the measurement screen. However, you cannot save the measurement data until the entire measurement process has been completed.

I hope I've made myself clear. Thank you.


ZIP
ColorCheck24-test1-P(4x6).mxf is compatible with ChromIQ.

The row/column arrangement follows the i1Profiler convention. For example, a 4 × 6 layout in i1Profiler corresponds to a 6 × 4 layout in ChromIQ.
 

Attachments

@jctay thank you for the ColorChecker files and the explanation, that was a very clear way to show it. Here is what we found, and the options we see. I would like to hear your opinion before we change anything.

What your five files show
  • All five files hold the same measurement: the same 24 patches with identical readings (M0, M1 and M2), saved five times under five page layouts. Only the save time differs.
  • Your chart has 4 strips of 6 patches, so ChromIQ's how-to note asks i1Profiler for 6 columns and 4 rows. The 4x6 file has exactly that grid, which is why it passes.
  • The other four (12x2, 5x5, 6x4 and 1x24) are refused for one reason only: the turned grid check. Nothing else in them is wrong. When we switched that check off in a test, all four imported with exactly the same values as the 4x6 file, every reading on its right patch.
  • You are right about the 5x5 filler: i1Profiler shows it on screen, but it is not saved in the .mxf, and it sits at the very end, so it never moves any other patch. ChromIQ handles it correctly.
  • You are also right that i1Profiler does not allow any number of columns: it chooses the number of rows first and then fills the columns (24 patches on 2 rows always become 12 columns, so 23 is impossible). We could not reproduce the 13 columns problem with about 600 patches, though: i1Profiler 3.8.8 laid out ChromIQ's own turned chart of 600 patches at 13 columns without trouble. If you still have that file, I would be glad to look at it. A list of exactly 600 entries made by hand would not work, because ChromIQ adds a few filler patches at the end of the last strip, and i1Profiler would put its own fillers in a different place.

Why ChromIQ has the grid check at all
Your files show what i1Profiler does with a measurement that is already finished: it simply arranges the readings again for the new page, and they stay correct. The check is there for a different case: someone who measures the printed sheet while i1Profiler shows a grid that does not match it. In strip mode i1Profiler most likely notices, because the number of patches in the scan does not match the row. But in Spot mode, patch by patch, nothing counts patches, and we do not know whether i1Profiler checks the colour there at all (in strip mode, other users have reported that its colour check is loose). Then a complete file could be saved with readings on the wrong patches, and the profile would be wrong without anyone noticing. Unfortunately the saved file cannot tell these two cases apart: it records no time per reading and nothing about how a patch was read.

The options we see

1. Keep it as it is.
  • Advantage: no risk at all of wrong readings in a profile, and nothing new to test.
  • Disadvantage: a correct measurement is refused whenever the page settings were changed after measuring. The way out works (set the page back in i1Profiler and save again, as the 4.3.29 message explains), but it is an annoying extra step and it feels like ChromIQ does not trust a measurement that is fine.

2. When the grid differs, let ChromIQ look at the measured colours themselves.
The chart file knows roughly what colour every patch should have. ChromIQ would check whether the readings rise and fall together with those expected colours: lighter where a lighter patch is expected, redder where a redder one is expected, and so on. If they clearly do, the file is imported. If they clearly do not, or if ChromIQ cannot tell, it is refused as today.
  • Advantage: your re-saved files would simply import, and a measurement really taken on the wrong grid would still be refused. The decision is based on the readings themselves instead of on how i1Profiler drew the page.
  • We tried this on three real measurements (your 624-patch Selphy chart and two of our own with about 900 and 1200 patches): readings on their own patches agreed strongly (a score of 0.82 to 0.98, where 1 is perfect), readings shifted onto a wrong grid did not (0.24 or less on a randomised chart, 0.5 or less on a chart sorted by colour).
  • Risk: these were simulations, not real wrong scans. And on a very small chart sorted by colour (like a 24-patch chart in lightness order), the difference becomes thin, up to 0.65. In those cases ChromIQ would say it cannot tell and refuse, so the worst case is the same as today, not a wrong profile. Charts made of very similar colours would also end up in "cannot tell".
  • Effort: a new check and new message texts in all 13 languages, so it takes a release cycle with careful testing.

3. Accept any grid after asking the user to confirm.
  • Advantage: simple, and it never stops a correct measurement.
  • Risk: the very person who measured on the wrong grid is the one who does not know it, so they would click "yes" and get a wrong profile. That is exactly what the check is meant to prevent, so we do not like this one.

How we weigh them
Option 3 moves the risk onto the user without any protection, so we would rule it out. Between 1 and 2: option 1 is the safest but keeps refusing correct files like yours. Option 2 keeps the same protection where it matters (a wrong measurement is still refused, and when in doubt ChromIQ refuses as today) while letting correct re-saved files through. Its weak spot, small charts sorted by colour, falls back to today's behaviour rather than to a wrong profile. So we lean towards option 2, but we would like to know what you think, since you use the turned export more than anyone.

A test that would settle the open question, if you find the time
Print a small turned chart from ChromIQ (for example 4 strips of 6), set i1Profiler to a different grid such as 5x5 or 12x2, and:
  • try to scan one printed strip in strip mode. Does i1Profiler accept it, or does it complain?
  • then switch to Spot mode and measure a patch whose colour is clearly not the one i1Profiler shows on screen. Does it accept it?
If i1Profiler refuses both, the risk behind the check is much smaller than we assume, and that would make option 2 (or even a simpler one) an easy decision.

Thanks again for all the testing!
 
My printer is not large enough to print a strip containing 24 patches. :he

Nevertheless, I am confident that this should not present a problem. What you see on screen is what you get in the final output.

In Spot mode, i1Profiler does not perform any color discrepancy checks. In other words, it simply accepts the input data without validating its accuracy. As the saying goes, "Garbage In, Garbage Out."

In Scan mode, i1Profiler is also less aggressive than ChromIQ when it comes to enforcing color discrepancy checks.

However, repeatability is a critical factor in patch measurement. Users should be able to compare multiple sets of spectral readings to assess measurement consistency and reliability. This usually requires the use of third-party applications.

Ultimately, the user should decide what level of tolerance is acceptable, whether it is ΔE < 0.8 or a stricter ΔE < 0.5 or what?

With the i1Pro3, I typically achieve ΔE < 0.35, or even better, between two sets of measurements. Occasionally, a few patches show slightly higher discrepancies, around ΔE 0.7 or 0.8, which I consider normal.

The i1Pro2, the second-generation i1Pro, offers considerably better measurement consistency than the original i1Pro1.

The i1Pro1 can also achieve relatively low ΔE values, provided the instrument is recalibrated more frequently during measurement to compensate for measurement drift. I have previously conducted repeatability studies on the i1Pro1 and confirmed this through testing.

My main question is: Does ChromIQ provide a way to compare two sets of spectral measurements to evaluate measurement repeatability and consistency?

I believe this would be a useful feature, allowing users to assess measurement reliability rather than relying solely on ChromIQ's built-in discrepancy checks.

The above are my personal opinions.


/ As for the 13-column issue, I don't have an answer at the moment, as I didn't keep a record of it. I'll try to find out the exact patch size.
 
@jctay thank you, that is a very good point, and the information about Spot mode is important for us. Here is what we found when we looked at your question.

Can ChromIQ compare two sets of readings today?
Partly. This is what already exists:
  • Tools > Measurement info: open one measurement (.ti3), choose "Verify" and, under "Compare against", choose a second .ti3 of the same chart as the reference. ChromIQ then shows the average and the largest ΔE2000 between the two sets, which patch differs most, and the average per hue. An i1Profiler .mxf can be compared too, after converting it with Tools > Convert i1Profiler → TI3.
  • The Measurement Report has a row "Maximum ΔE00, the same chart measured again". It compares each dated verification print with the one before it, with a limit you can change (Default 3.0, Tight 1.5, or your own value) and a graph of how it develops over time. It is meant for watching a printer over weeks, not for comparing two profiling reads.
  • While measuring, ChromIQ compares a patch you read again with its earlier reading (the yellow outline, tolerance in Preferences > Measurement), and recognises a strip that was read twice.

What is missing
What you describe is not there yet: the 95th percentile, a list of the worst patches, and a tolerance you choose yourself, such as 0.5 or 0.8, with the number of patches above it. Averaging several reads also does not show how far they differ. And the comparison in Measurement info pairs the two files by patch number without checking that they really hold the same patches, so two files of the same chart saved on different grids are compared patch by wrong patch (we tried it: an "average" of 18 ΔE instead of an error message). We are thinking about adding all of this to that window, but have not decided yet.

Two bugs we found on the way
Tools > Verify against reference has two faults in 4.3.29, which we are fixing now for the next update:
  • Loading a .ti3 measurement as the reference fails with "Line 1 doesn't have three numbers", although the help says a measurement file works.
  • Pasted Lab reference values only work when "3D difference map" is ticked; otherwise the comparison cannot find its reference file.

Is ChromIQ stricter than i1Profiler?
On its own measurements, yes: it checks every reading against the colour it expects, compares neighbouring patches, recognises a strip read twice or slipped by one patch, and offers to read a suspicious patch again. None of these throws a measurement away, they point you to the patches worth a second look. On files imported from i1Profiler, on the other hand, ChromIQ checks no colours at all today, only that the file belongs to the chart. That is why your information about Spot mode matters: if i1Profiler accepts any reading in Spot mode, then a check of the measured colours against the chart (option 2 from my last post) is the only thing that could catch readings of the wrong patches. So it makes option 2 more useful, possibly for every i1Profiler import and not only when the grid differs.

A small correction about the test
Sorry, I explained it badly: the test does not need a strip of 24 patches. A small turned chart of 4 strips with 6 patches each is enough. Print it, set i1Profiler to another grid (for example 5x5 or 12x2), and try to scan one printed strip of 6. If you find the time, that would tell us whether i1Profiler's strip mode lets a wrong grid through.

And thanks for looking for the patch size of the 13-column chart, no hurry with that.
 
13-column Issue

I may not have kept any records or test results related to the 13-column issue.

However, the following may also be related and might be of interest to you.

192-Patch Layout
Paper width set to 141.4, column=12
Example-1.png


Paper width set to 141.5, column=13
Example-1a.png


The .txf files may be outdated, but I suspect the issue could be related to i1Profiler.


ZIP

From ChromIQ:
CP1500-192p.ti2
CP1500-192p-i1profiler-turned-i1Pro2.txf
CP1500-192p-i1profiler-turned-i1Pro3.txf

From i1Profiler:
CP1500-192p-turned-i1Pro3(1page-i1Profiler-Reorded).txf
 

Attachments

192-Patch Layout
Paper width set to 141.4, Paper width height set to 170.9, row=8 column=12
Paper width set to 141.4, Paper width height set to 171.0, row=16 column=12
missing row 9 to row 15
sshot-20.png


sshot-19.png
 
Last edited:
Can you identify the trend?

Round the numerical values to whole numbers.
 
Back
Top