A basic guide (see post #1) to setting up ARGYLL CMS profiling on your computer

@pharmacist

Here are the results of my tests:
The 480 proved very easy and quick to read. I printed the .tif on my Pro9000 II, with a new printhead (the old one finally gave up the ghost) and 8 IS inks (Pro Platinum on Sihl).
I have attached some Gamutvision screens, which show excellent results, no dog leg in the B&W density and good linearity. Generous, smooth colour gamut and good simulated colour checker.

View attachment 1190 View attachment 1189 View attachment 1191

Hi Emulator
This screen shot is my test results.
I used 480 targen with CM,printed by Epson L805.
The photo paper is RCS Glossy Pro.
Compare your results is very close.
So in my test is successful right?
111.png222.png333.png
 
Hi all,

i began to experiment with Argyllcms to profile my paper, for my Epson XP 15000 printer with CMYK + Red + Grey (6 inks in all)

My device is an i1pro rev. d no uv-cut

My targen charts are generated in this way

******** MAC OS SCRIPT ****
#!/bin/bash
TIME=`date "+%Y%m%d-%H%M"`
PATCHES=860
WHITE=8
BLACK=8
GREY=128
PAPER="300x214"
echo "Generating MY $PATCHES patches on $PAPER sheet"
echo targen -v -d2 -e$WHITE -B$BLACK -G -g$GREY -t -f$PATCHES "my $PATCHES $PAPER $TIME"
targen -v -d2 -e$WHITE -B$BLACK -G -g$GREY -t -f$PATCHES "my $PATCHES $PAPER $TIME"
echo
echo printtarg -v -ii1 -b -a0.84 -T360 -P -m1 -p$PAPER -L "my $PATCHES $PAPER $TIME"
printtarg -v -ii1 -b -a0.84 -T360 -P -m1 -p$PAPER -L "my $PATCHES $PAPER $TIME"
echo chartread -v -H -B -T0.4 "my $PATCHES $PAPER $TIME"
chartread -v -H -B -T0.4 "my $PATCHES $PAPER $TIME"
echo colprof -v -qh -S AdobeRGB1998.icc -dpp -D"PRINTERMODELL INKSET PAPERTYPENAME" "my $PATCHES $PAPER $TIME"
colprof -v -qh -S AdobeRGB1998.icc -dpp -D"PRINTERMODELL INKSET PAPERTYPENAME" "my $PATCHES $PAPER $TIME"

in this way i can modify the parameters how i prefer (in the future i could use the passing parameters on the command line,

i copied this targen from some post i found (maybe from CLS user) and it differs from your for the -t parameter that would increment far point for full spread

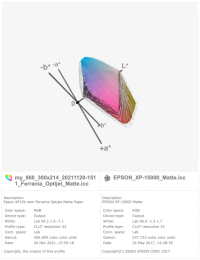
I tried to profile a Ferrania Optijet Matte Paper 120gsm and i made a diff with the Epson Matte Paper 167gsm oem profile included with the Epson XP 15000, you can see in the images the differences between sRGB/AdobeRGB color space and the Epson Matte paper, sRGB and Ferrania Matte, Epson Matte vs Ferrania Matte to show where Ferrania paper has more gamut and Ferrania Matte vs Epson Matte to show where Epson paper has more gamut

Now the question are:

- is normal that also the Epson Matte profile is not matching the gamut of the sRGB color space ?

- is normal that at L:0 a:0 b:0 in any color space matches with L:50 a:0 and b:0 in the profile ? I suppose because the colprof for default is using D50 right ?

- maybe i choose too many White/Black/Grey target and this reduced the colors gamut ?

- maybe the -t option of targen has to be omitted to get a better chart sheet ?

- maybe the paper is not so good ?

- maybe the printer gamut is phisically limited ?

- the CAP480 options could give a better profile ?

- another chart test using the previous one like optimization will create a better profile than actual ?
 

Attachments

  • Screenshot 2021-11-22 at 11.49.53.png
    Screenshot 2021-11-22 at 11.49.53.png
    208.3 KB · Views: 546
  • Screenshot 2021-11-22 at 11.43.27.png
    Screenshot 2021-11-22 at 11.43.27.png
    192.7 KB · Views: 498
  • Screenshot 2021-11-22 at 11.40.28.png
    Screenshot 2021-11-22 at 11.40.28.png
    228.5 KB · Views: 494
  • Screenshot 2021-11-22 at 11.38.54.png
    Screenshot 2021-11-22 at 11.38.54.png
    232.8 KB · Views: 486
  • Screenshot 2021-11-21 at 16.39.23.png
    Screenshot 2021-11-21 at 16.39.23.png
    219.5 KB · Views: 497
  • Screenshot 2021-11-21 at 16.35.23.png
    Screenshot 2021-11-21 at 16.35.23.png
    262.2 KB · Views: 474
  • Screenshot 2021-11-21 at 16.34.33.png
    Screenshot 2021-11-21 at 16.34.33.png
    245.7 KB · Views: 536
Last edited:
Hi, everyone,

first of all, I would like to THANK everyone who has invested the time, work and money (ink is not cheap) in generating the best test charts and who are here to share their knowledge with all of us.

I'm a big fan of the 480-patch target, which is so small but also gives such a good result while saving ink, paper and measurement time.

So I played a bit with the number of patches per row and line and the paper size to optimize it for my needs: Number of patches should stay around 480, the print should be easy measured with both the i1 and the ColorMunki and it should be printable with nearly no corrections like resizing.
I want to use it for some comparson between the i1 and the ColorMunki

The result is a target with 483 patches, A4, 23x21 patches.
The patch width is 8,22mm so that 5 rows are the width of the ColorMunki for easy guiding (I used a simple typoruler).
The target format also works easy with the i1 ruler and have enough white space at the start and the end of a line.

After creating the TIF target only the white space on the right needs to be cropped and after it's ready to be printed centered on a page.

Here are the changed command lines:
targen -v -d2 -G -e6 -B5 -g128 -f483 Argyll_RGB_483
printtarg -v -t300 -ii1 -a1.03 -A0.9 -R1 -b -m0 -M0 -P -L -p235x265 Argyll_RGB_483

chartread and colprof are identical to the ones in CAP480.txt from page 1 of this thread.


Best wishes and a good start to 2022 – stay healthy
 

Attachments

  • i1-vs-ColorMunki.png
    i1-vs-ColorMunki.png
    277.6 KB · Views: 494
  • i1pro.jpg
    i1pro.jpg
    152.5 KB · Views: 511
  • ColorMunki.jpg
    ColorMunki.jpg
    208 KB · Views: 494
My device is an i1pro rev. d no uv-cut
the print should be easy measured with both the i1 and the ColorMunki and it should be printable with nearly no corrections like resizing.
I want to use it for some comparson between the i1 and the ColorMunki
That adds an unknown parameter into the comparison and profile generation - UV cut of the Color Munki vs. no UV cut of the i1Pro. I compared profiles a while ago generated either with the i1Studio - pretty much the same as the ColorMunki - and the i1Pro2 in the M2 - UV cut - mode, I got much smaller differences than yours.
 
That adds an unknown parameter into the comparison and profile generation - UV cut of the Color Munki vs. no UV cut of the i1Pro.
Thanks for clarifying this point – of course you're right and one should keep that in mind.
For me this was just a staring point for more experiments and the i1pro 3 is ordered just before christmas :-)
My slightly changed parameters should only simplify my (and maybe someone elses) target print and measure process, no matter what device is used.
 
Last edited:
I use Little Argyll (a graphic shell around Argyll) because it´s simplier for me. And as I do not profile so often, I have made a simple tutorial - for myself. It saves me a lot of time, so I enclose it if someone out there could have benefit of it.
 

Attachments

Last edited:
Also based on cap480.bat.

Tried few tweak about printtarg, but seems like my favor still similar to the original one. It's 484 but without any crop.
REM printtarg -v -ii1 -a1.05 -A0.6 -T300 -R21 -m2 -P -pA4 %pcn2%
printtarg -v -ii1 -a1.15 -A0.6 -T300 -R21 -m0 -P -L -pA4 %pcn2%
REM printtarg -v -ii1 -a1.13 -A0.6 -L -T300 -R21 -m2 -P -pA4R %pcn2%
REM printtarg -v -iCM -a0.6 -m0 -L -T300 -R21 -n -P -p370x250 %pcn2%
REM printtarg -v -iCM -a0.6 -m0 -L -T300 -R21 -n -P -p380x240 %pcn2%
REM printtarg -v -iCM -h -m0 -L -T300 -R21 -n -P -p212x300 %pcn2%

But I use another program mmmunki (github links) to replace the chartread.
Since it provides multiple read charts & select result as below description:
"Selects measurement with minimum total color difference with all other measurements. Delta E can be considered as the distance between two colors in the color space. For each measurement, the sum of distances to all other measurements is calculated. A measurement is selected with a minimum sum of distances."

I always try to measure at least 3 times till deltaE2000 smaller than 0.2.

It also mentioned about "Thirdly, in order to avoid buffer overflow, the utility allows you to break a strip with patches into fragments and read one fragment per pass. Then the data for each fragment are combined into a strip."
But I haven't figure out how to use it.

Note: mmmunki need to use older XRD driver (tested XRD_Manager_3.1.7.6, don't use latest version with i1studio like )
PXL_20211227_011437295.jpg
 

Attachments

Last edited:
Hi All, I am playing around with the Color Munki and ArgyIICMS, I run my test on very cheap glossy paper (until I get some working workflow).

I did a profile with i1 studio (default CM software) and another one with Argy. I am quite surprised to see the black levels of the profile generated by Argy that high:

I ran these commands:

./bin/targen -v -d2 -G -e6 -B5 -g128 -f495 test
./bin/printtarg -v -t300 -ii1 -a1.05 -A0.6 -R1 -b -m0 -M0 -P -L -p287x200
Then photoshop the target tiff to crop it correctly (didn't change the color profile, actually there is no color profile)

./bin/colprof -v -qu -i D50 -o 1931_2 -S AdobeRGB1998.icc -cmt -dpp test

Any ideas?


I printed the chart using Adobe color printer utility (printing with photoshop gave me weird profiles: spikes, holes...)


EDIT:
I simulated-color proofing with back point enabled and paper in under Photoshop. The Argy profile look better, not weird transition on the black stripe (relative colorimetric)
 

Attachments

  • argy solid - i1 studio wired.png
    argy solid - i1 studio wired.png
    417.8 KB · Views: 488
  • argy -rela.png
    argy -rela.png
    1.4 MB · Views: 494
  • xrite -rela.png
    xrite -rela.png
    1.4 MB · Views: 537
Last edited:
I'm lost what you are doing and don't understand why you are getting such diffrerent blackpoints in your last profile display above - argy solid - i1 studio wired - what is causing these differences ?
 
this is also what I would like to understand. My assumption is in the algorithm used by Argy. in the attachment you can find the files.
the ".ti1" is the patches, the ".ti2" is the patches position on the paper, and the ".ti3" is the measured values.
 

Attachments

Back
Top